Page 4 - Benchmark: ATTO Disk Benchmark
About ATTO Disk Benchmark
The ATTO Disk Benchmark performance measurement tool is compatible with Microsoft Windows. Measure your storage systems performance with various transfer sizes and test lengths for reads and writes. Several options are available to customize your performance measurement including queue depth, overlapped I/O and even a comparison mode with the option to run continuously. Use ATTO Disk Benchmark to test any manufacturers RAID controllers, storage controllers, host adapters, hard drives and SSD drives and notice that ATTO products will consistently provide the highest level of performance to your storage.
From: Developer's Page
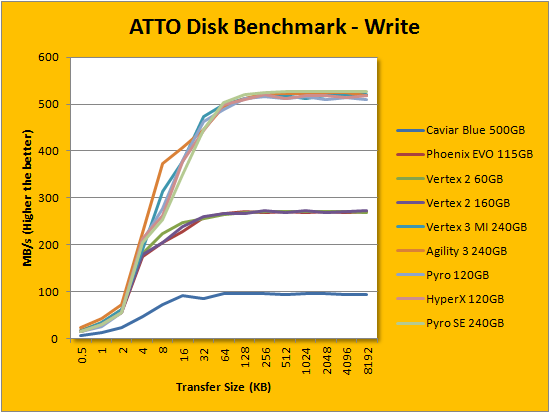
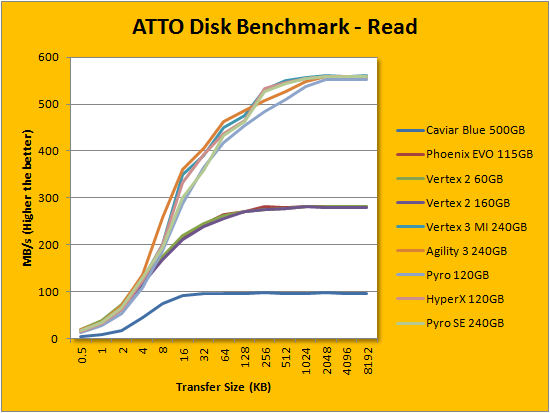
Following up next is our usual ATTO read and write tests. ATTO is an often quoted benchmark because it is easy to use and accurate. For the most part, it is a favorite among reviewers, and I've grown to embrace it as much as the next for the last little while. ATTO uses easily compressible data, so SandForce based SSDs will perform very well here. As manufacturer peak read and write performance ratings are usually done in ATTO as well, whether a drive lives up to its marketing claims or not can be validated by this program. Patriot claims the Pyro SE 240GB's maximum read is 550MB/s, whereas its maximum write is pinned at 520MB/s. According to our tests, it is underrated by nearly 10MB/s on both numbers -- an impressive feat. Peaking at 559.2MB/s read and 527.6MB/s write, the Patriot Pyro SE 240GB's curve is also consistent with other SF-2281 drives we have tested in the past. Actually, its write maximum is a hair ahead of the OCZ Vertex 3 Max IOPS 240GB, and this is nothing to laugh about.
Page Index
1. Introduction and Specifications
2. A Closer Look, Installation, Test System
3. Benchmark: AIDA64 Disk Benchmark
4. Benchmark: ATTO Disk Benchmark
5. Benchmark: Crystal Disk Mark 3.0
6. Benchmark: HD Tach 3.0.1.0
7. Benchmark: HD Tune Pro 4.60
8. Benchmark: PassMark PerformanceTest 7.0
9. Benchmark: PCMark Vantage
10. Conclusion