Page 4 - Benchmark: ATTO Disk Benchmark
About ATTO Disk Benchmark
The ATTO Disk Benchmark performance measurement tool is compatible with Microsoft Windows. Measure your storage systems performance with various transfer sizes and test lengths for reads and writes. Several options are available to customize your performance measurement including queue depth, overlapped I/O and even a comparison mode with the option to run continuously. Use ATTO Disk Benchmark to test any manufacturers RAID controllers, storage controllers, host adapters, hard drives and SSD drives and notice that ATTO products will consistently provide the highest level of performance to your storage.
From: Developer's Page
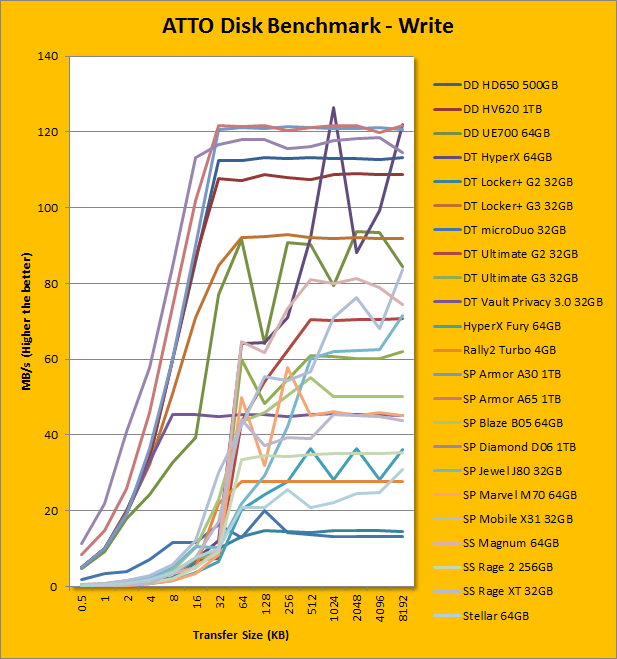
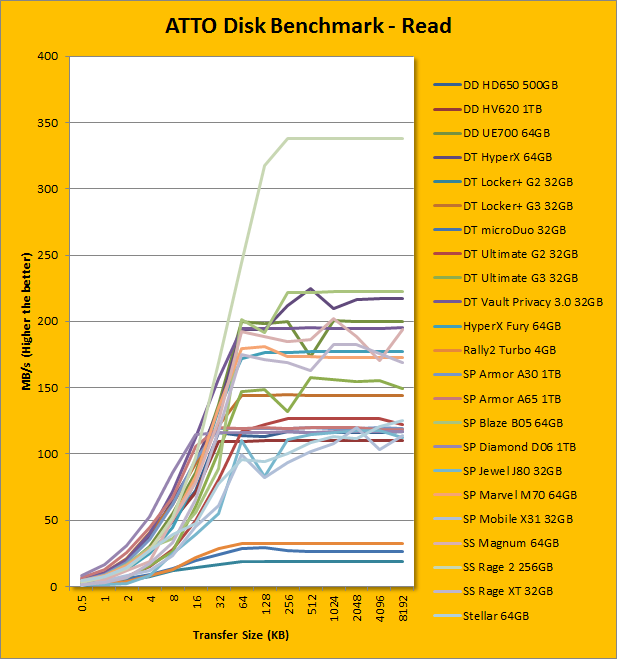
Following up next is our usual ATTO read and write tests. ATTO is one of my favorite benchmarks for quite a while. Ever since we have started using it in my network attached storage reviews a few years ago, it has been integral to our battery of storage performance evaluations here at APH Networks -- mainly due to its accuracy, and thorough testing in accordance to varying transfer sizes. As you can see in our graphs above, the Silicon Power Armor A65 1TB's read performance and write performance was roughly the same; peaking at 116.711MB/s and 121.739MB/s, respectively. Under the curve, the Silicon Power Armor A65 1TB reached maximum performance for everything 32K and above. The ramp up speed was faster than the Armor A30, but below the Diamond D06, despite having the same hard drive inside. Of course, as we move to larger transfer sizes, they were all pretty close, as demonstrated in the posted comparison charts.
Page Index
1. Introduction, Packaging, Specifications
2. A Closer Look, Test System
3. Benchmark: AIDA64 Disk Benchmark
4. Benchmark: ATTO Disk Benchmark
5. Benchmark: Crystal Disk Mark 3.0
6. Benchmark: HD Tach 3.0.1.0
7. Benchmark: HD Tune Pro 4.60
8. Conclusion