Page 2 - Test System and Benchmarks
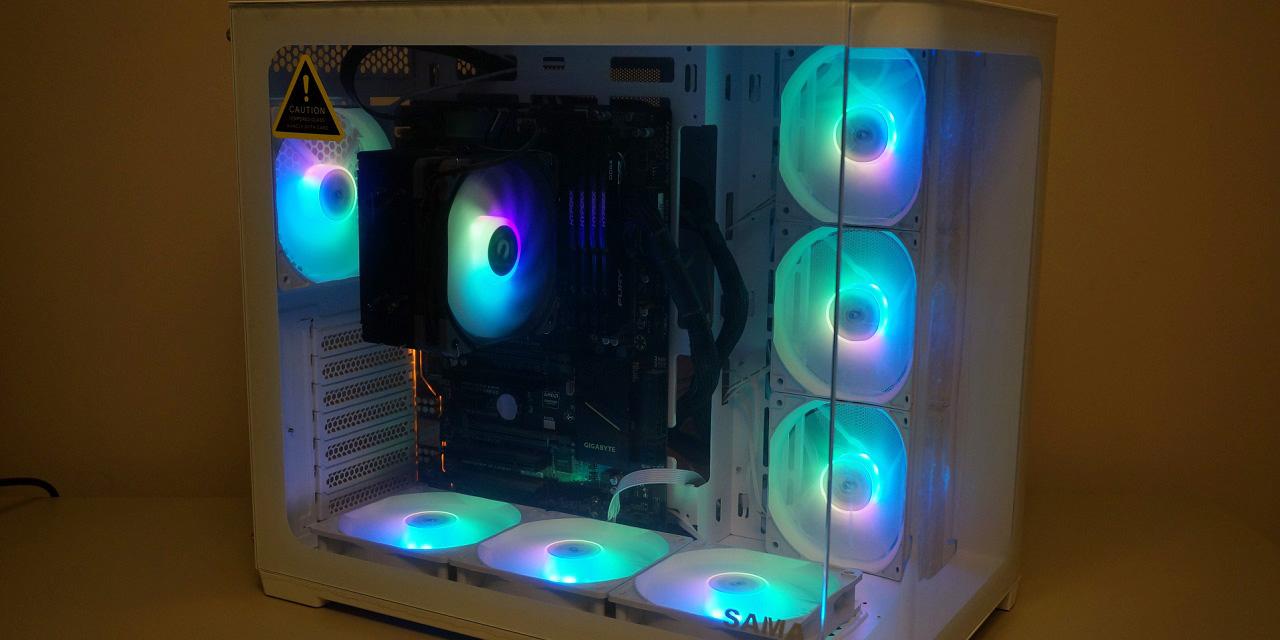
Do you see the RAM? I don't! I think it camouflages pretty well. Perfect for LAN parties... no one is going to steal your RAM. You know why? Because they can't see it!
Anyway, back on topic, our tests were conducted on computer with the following specifications. For all standard performance ratings (Non-overclocking), all components will be ran at default/stock settings for maximum accuracy. If results are within a few percent of each other, the performance will generally be the same as there is an error margin.
CPU: Intel Core 2 Duo E6300 (1.86GHz Dual Core)
Motherboard: Asus P5W64-WS Professional (i975X)
Graphics: BFG GeForce 7600GT OC 256MB
Power Supply: Tagan TurboJet 1100W
Case: Thermaltake Aguila (1x120mm LED, 1x120mm standard)
Storage: Seagate 7200.10 320GB 16MB Cache SATA2
Optical: NEC AD-7170A 18X DVD+/-RW
Sound: Creative X-Fi XtremeMusic
OS: Microsoft Windows XP Professional SP2
Comparison memory:
- OCZ Special Ops Edition Urban Elite PC6400 @ 4-4-3-15 Dual Channel
- Buffalo Firestix PC6400 @ 5-5-5-15 Dual Channel
Again, all components including RAM are ran at stock latencies and voltages.
Cinebench 9.5
From the developers: CINEBENCH is the free benchmarking tool for Windows and Mac OS based on the powerful 3D software CINEMA 4D. Consequently, the results of tests conducted using CINEBENCH 9.5 carry significant weight when analyzing a computer’s performance in everyday use. Especially a system’s CPU and the OpenGL capabilities of its graphics card are put through their paces (even multiprocessor systems with up to 16 dedicated CPUs or processor cores). During the testing procedure, all relevant data is ascertained with which the performance of different computers can subsequently be compared, regardless of operating system.
CINEBENCH includes render tasks that test the performance of up to 16 multiprocessors on the same computer as well as software-only shading tests and OpenGL shading tests on huge numbers of animated polygons that will push any computer to its limits.
CINEBENCH 9.5 is available for Windows 32-bit and 64-bit operating systems and as a “Universal Binary” version for Apple Macintosh computers with PowerPC or Intel Core Duo processors. The database functionality and simple export allow for easy statistical data collection. CINEBENCH is used extensively by leading trade journals and hardware manufacturers such as Intel, AMD and Apple to compare computer performance.

Basically the same performance. I ran the test a few times with the same results -- maybe the better latencies helped, or just part of the error margin?
EVEREST Ultimate Edition 3.50.799
From the developers: EVEREST Ultimate Edition is an industry leading system diagnostics and benchmarking solution for enthusiast PC users, based on the award-winning EVEREST Technology. During system optimizations and tweaking it provides essential system and overclock information, advanced hardware monitoring and diagnostics capabilities to check the effects of the applied settings. CPU, FPU and memory benchmarks are available to measure the actual system performance and compare it to previous states or other systems. Furthermore, complete software, operating system and security information makes EVEREST Ultimate Edition a comprehensive system diagnostics tool that offers a total of 100 pages of information about your PC.
CPU and FPU benchmarks
State of the art multi-threaded benchmark methods to measure performance of both old and brand new processors. References list to compare actual performance with other systems.
Memory benchmarking
Memory read and write speed, memory latency measurement to stress the memory and cache subsystem, including references list to compare actual performance with other systems.


Again, virtually identical performance on most tests. However, in the EVEREST CPU PhotoWorxx benchmark, the OCZ SOE Urban Elite has quite a performance edge (At least on paper). Also worth mentioning is information presented in the EVEREST Memory tests -- the OCZ SOE Urban Elite has a nice lead on the Copy and Read tests. The latency tested is also lower than the Buffalo Firestix.
PCMark05

Virtually identical performance is tested in PCMark05. Each has a few point lead in this or that test category; but strangely the PCMark05 Overall mark is higher with the Buffalo Firestix. This could be due to hard drive burst differences, however, which is not necessarily RAM related.
3DMark06

The Buffalo Firestix oddly has a slight performance edge on paper over the OCZ SOE Urban Elite RAM. Again, this is part of the margin of error -- so we can say the performance is basically identical.
SuperPI 1 Million Digits

29 seconds to calculate 1 million digits of Pi for both. On the other hand, if you want to calculate Pi faster, you might want to consider a faster CPU with nice overclockable memory (An E6300 running at 2.8GHz can calculate it in 19 seconds), which we'll get to shortly.
Page Index
1. Introduction, Packaging, Specifications
2. Test System and Benchmarks
3. Overclocking and Conclusion
