Page 5 - Benchmark: Crystal Disk Mark 8.0
About Crystal Disk Mark
- Measure Sequential and Random Performance (Read/Write/Mix)
- Peak/Real World Performance Profile
From: Developer's Page
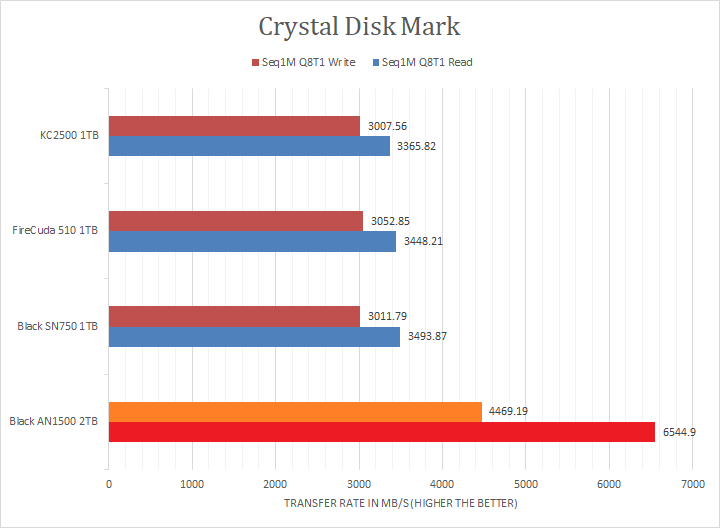
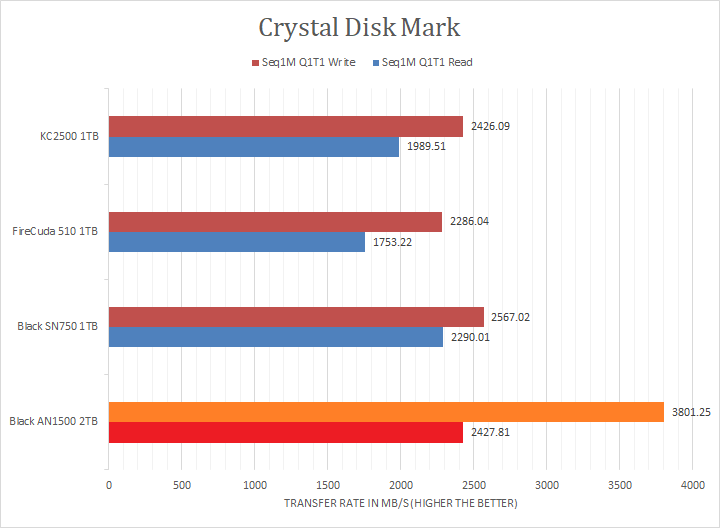
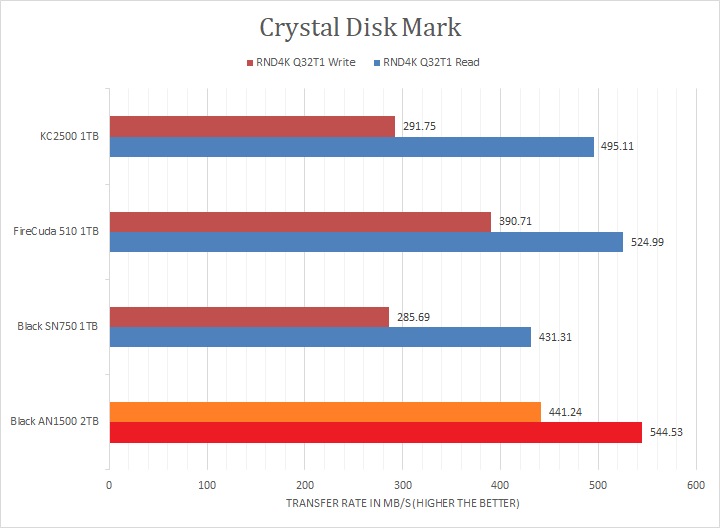
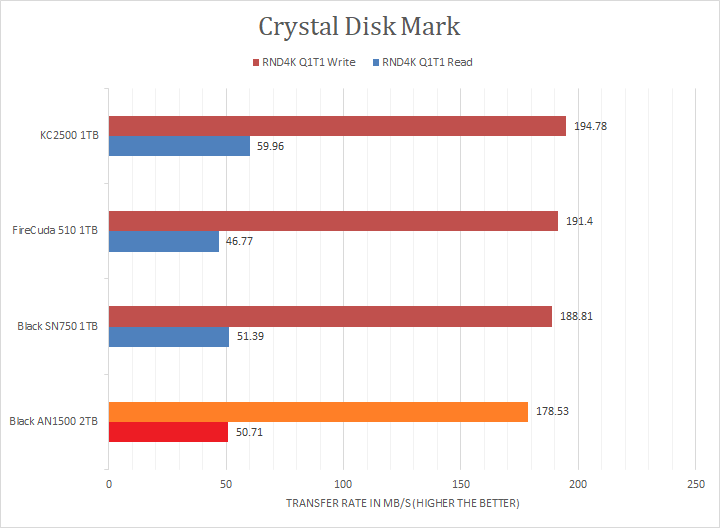
Crystal Disk Mark 8.0 is in the spotlight. Just a bit of background information, higher capacity drives tend to perform a little better in these tests. The ability of a controller and flash memory to deliver high IOPS will provide huge benefits to the score as well. The WD_BLACK AN1500 2TB has no IOPS rating, but we know each SN730 1TB is rated for 550,000 IOPS and there are two of them inside in RAID 0. Looking at the read and write results of all four sections, the AN1500 2TB absolutely dominated the linear read and write section against the compared PCIe 3.0 NVMe drives and matched the advertised figures. It also dominated the Seq1M Q1T1 write test, but other drives got close in the read version. A similar but inverse pattern can be seen in the RND4K Q32T1 tests. Lastly, in the RND4K Q1T1 segment, the WD_BLACK AN1500 actually came in behind everyone in the write test, It managed to come back only ahead of the FireCuda 510 in the read test. I will let you make your own comparisons in our list of SSDs in the graphs above.
Page Index
1. Introduction, Packaging, Specifications
2. A Closer Look, Test System
3. Benchmark: AIDA64 Disk Benchmark
4. Benchmark: ATTO Disk Benchmark
5. Benchmark: Crystal Disk Mark 8.0
6. Benchmark: HD Tach 3.0.1.0
7. Benchmark: HD Tune Pro 5.70
8. Benchmark: PassMark PerformanceTest 10
9. Benchmark: PCMark 10
10. Conclusion