Page 8 - Benchmark: PassMark PerformanceTest 8.0
About PassMark PerformanceTest 8.0
Fast, easy to use, PC speed testing and benchmarking. PassMark PerformanceTest allows you to objectively benchmark a PC using a variety of different speed tests and compare the results to other computers.
Thirty-two standard benchmark tests are available in five test suites plus there are seven advanced testing windows for custom benchmarking.
- CPU tests Mathematical operations, compression, encryption, SSE, 3DNow! instructions and more
- 2D graphics tests Drawing lines, bitmaps, fonts, text, and GUI elements
- 3D graphics tests Simple to complex DirectX 3D graphics and animations
- Disk tests Reading, writing and seeking within disk files
- Memory tests Allocating and accessing memory speed and efficiency
From: Developer's Page
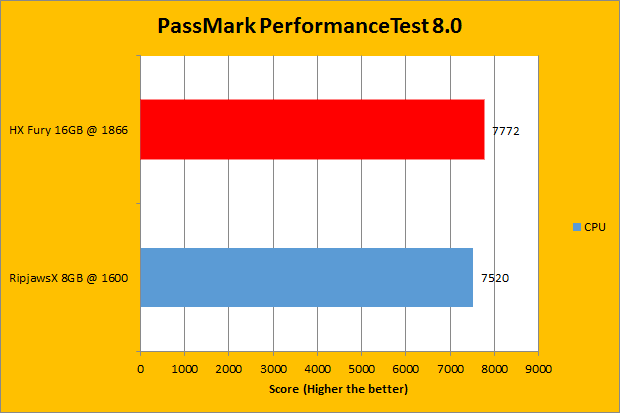
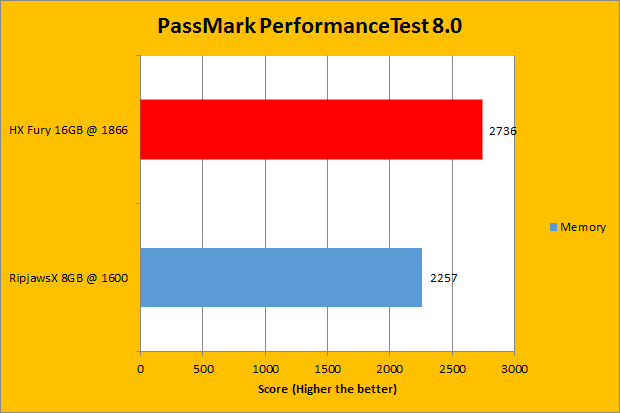
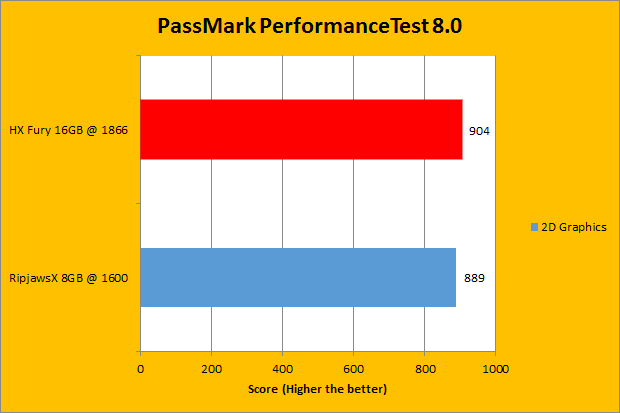

We have been using PassMark PerformanceTest in our battery of standard performance evaluation software here at APH Networks for quite a while now. PassMark Performance Test 8.0’s memory benchmarking tool is probably the only test in our setup that takes memory capacity into account. In a very general case, doubling the RAM will increase resulting scores by about 150%. Looking at our actual review units, the Kingston HyperX Fury kit is 16GB, while the G.Skill Ripjaws-X is only 8GB. The actual results, while they do not numerically reflect our past observations, show the difference between the two units, and is something we have expected. As for the rest of the graphs, the G.Skill memory unit only was victorious in the 3D Graphics, and only by sixteen points.
Page Index
1. Introduction, Packaging, Specifications
2. A Closer Look, Installation, Test System
3. Benchmark: AIDA64 CPU
4. Benchmark: AIDA64 FPU
5. Benchmark: AIDA64 Memory
6. Benchmark: PCMark 8
7. Benchmark: 3DMark
8. Benchmark: PassMark PerformanceTest 8.0
9. Benchmark: SuperPI 1M, Cinebench R15
10. Overclocking and Conclusion