Page 5 - Benchmark: Crystal Disk Mark 8.0
About Crystal Disk Mark
- Measure Sequential and Random Performance (Read/Write/Mix)
- Peak/Real World Performance Profile
From: Developer's Page
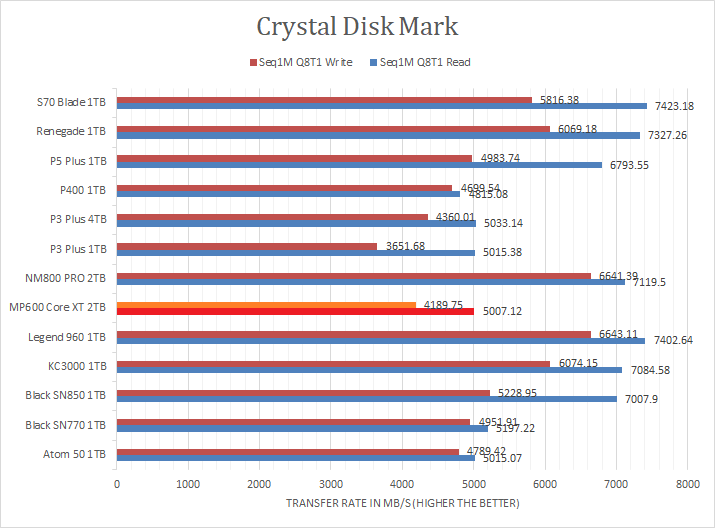
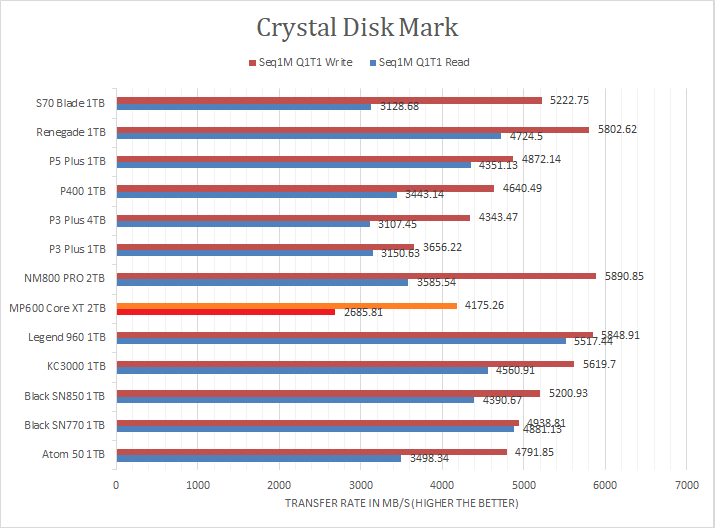
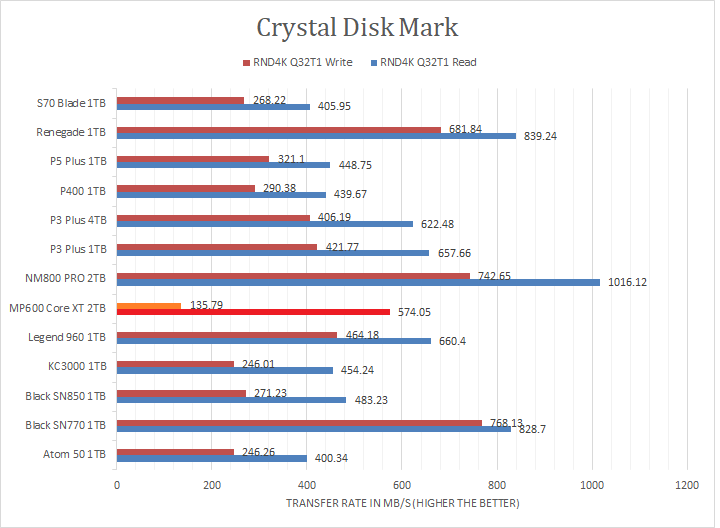
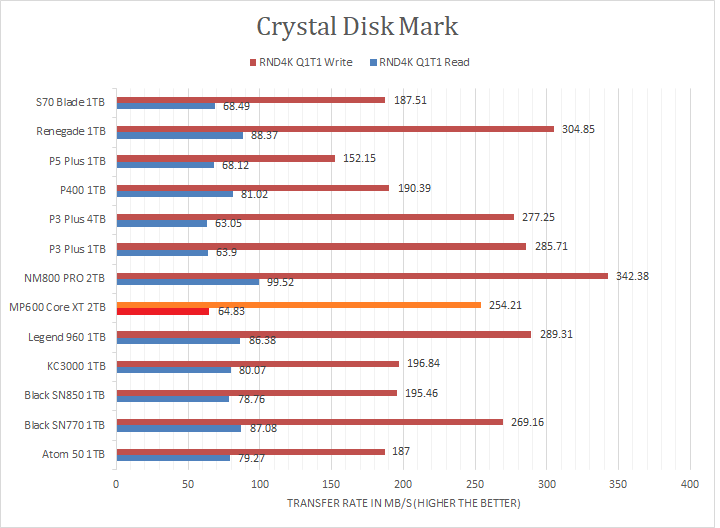
Crystal Disk Mark 8.0 is in the spotlight. Just a bit of background information, higher-capacity drives tend to perform a little better in these tests. The ability of a controller and flash memory to deliver high IOPS will provide huge benefits to the score as well. Taking a look at the results, the MP600 Core XT 2TB had lower results when it came to sequential read and write speeds, which is consistent with other budget PCIe 4.0-based budget drives. The Q8T1 read results specifically were consistent with the likes of the budget Crucial P3 Plus series. The random read and write performance were better, with the MP600 Core XT 2TB dropping in the bottom of the pack with the random 4K Q1T1 results. The random 4K Q1T1 read results were about on par with the P3 Plus 4TB and P3 Plus 1TB, while the random 4K Q1T1 write results landed the MP600 Core XT 2TB in the middle of the pack. The random 4K Q32T1 read also saw the drive scoring around the middle of the pack, although the random 4K Q32T1 results saw the drive falling behind by a wide margin. It is important to note that the MP600 Core XT 2TB was mostly on par with both the Crucial P3 Plus, both its 1TB and 4TB version.
Page Index
1. Introduction, Packaging, Specifications
2. A Closer Look, Test System
3. Benchmark: AIDA64 Disk Benchmark
4. Benchmark: ATTO Disk Benchmark
5. Benchmark: Crystal Disk Mark 8.0
6. Benchmark: HD Tune Pro 5.70
7. Benchmark: PassMark PerformanceTest 10
8. Benchmark: PCMark 10
9. Benchmark: 3DMark
10. Conclusion
