Page 9 - Benchmark: PassMark PerformanceTest 7.0
Fast, easy to use, PC speed testing and benchmarking. PassMark PerformanceTest allows you to objectively benchmark a PC using a variety of different speed tests and compare the results to other computers.
Twenty-eight standard benchmark tests are available in six test suites plus there are seven advanced testing windows for custom benchmarking.
- CPU tests Mathematical operations, compression, encryption, SSE, 3DNow! instructions and more
- 2D graphics tests Drawing lines, bitmaps, fonts, text, and GUI elements
- 3D graphics tests Simple to complex DirectX 3D graphics and animations
- Disk tests Reading, writing and seeking within disk files
- Memory tests Allocating and accessing memory speed and efficiency
- CD / DVD test Test the speed of your CD or DVD drive
From: Developer's Page

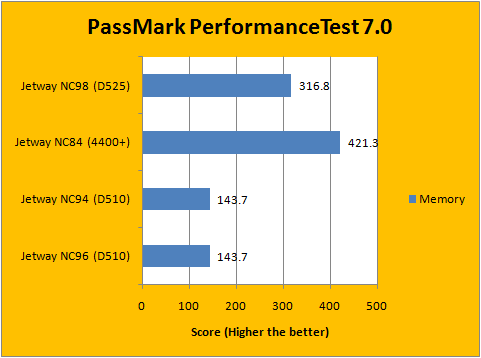
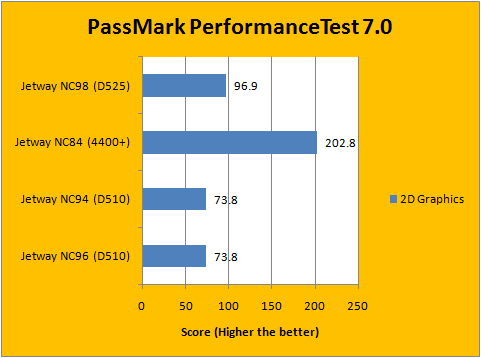
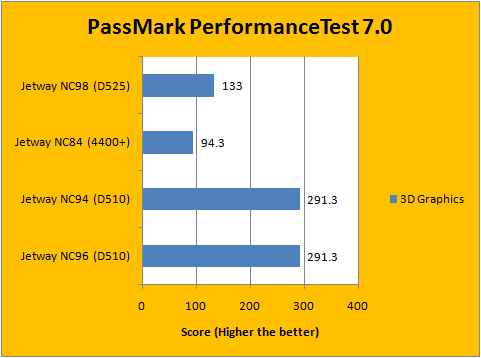
It should be no surprise by now that the Atom D525 kicked the D510's butt in almost every test. There is a weird part to this, where the 3D Graphics is actually higher for the D510 -- this is due to PassMark PerformanceTest 7.0's algorithm of determining the overall score. Since the D510 based system was unable to complete every test, the overall score ended up being higher. Again, the greater memory test score has quite a bit to do with the D525's higher FSB to compliment the RAM. In terms of 3D Graphics, the NC98 with NVIDIA Proton beats the Radeon HD 4200 equipped NC84, again due to again being a superior integrated graphics solution.
Page Index
1. Introduction, Features, and Specifications
2. Bundle, Chipset, BIOS
3. A Closer Look, Board Layout, Test System
4. Benchmark: EVEREST CPU
5. Benchmark: EVEREST FPU
6. Benchmark: EVEREST Memory
7. Benchmark: PCMark Vantage
8. Benchmark: 3DMark06 Professional
9. Benchmark: PassMark PerformanceTest 7.0
10. Benchmark: SuperPI 1M, Cinebench R11.5
11. Onboard Sound Frequency Analysis
12. Power Consumption and Conclusion
