Page 5 - Benchmark: Crystal Disk Mark 8.0
About Crystal Disk Mark
- Measure Sequential and Random Performance (Read/Write/Mix)
- Peak/Real World Performance Profile
From: Developer's Page
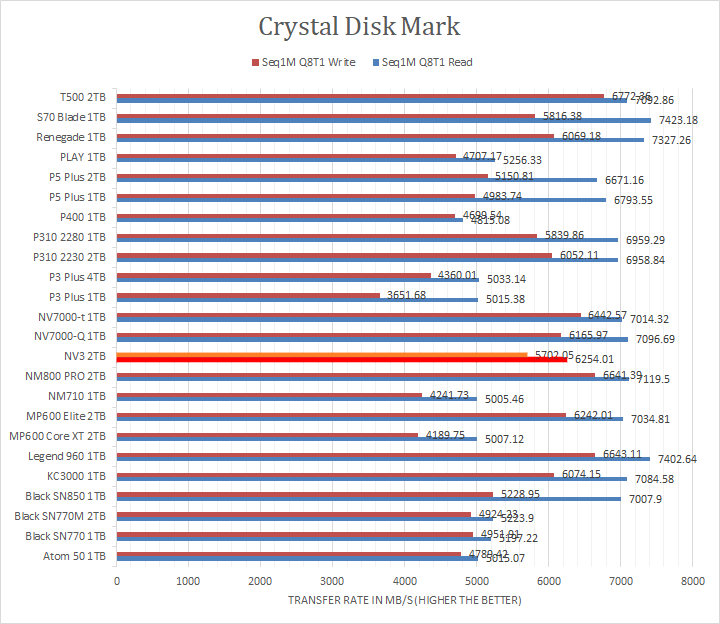
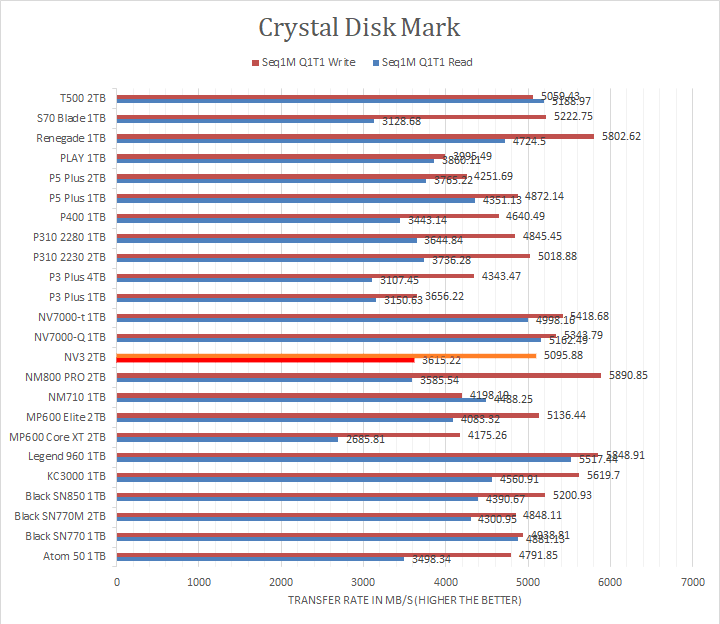
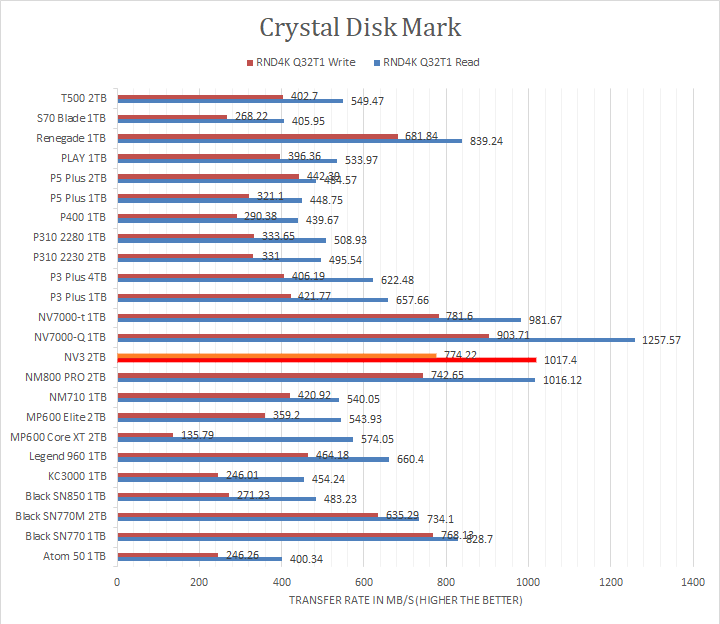
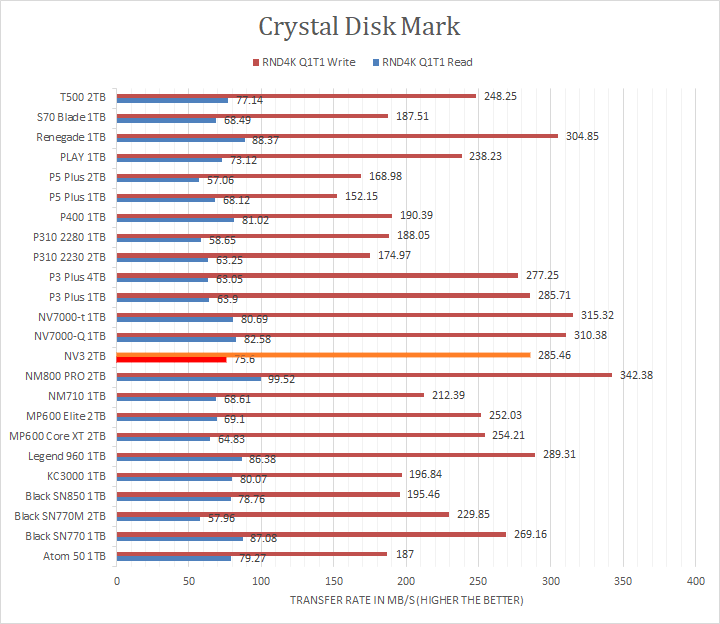
Moving on, Crystal Disk Mark 8.0 is our next benchmark. For a bit of background information, higher capacity drives tend to perform a little better in these tests. The ability of a controller and flash memory to deliver high IOPS will provide huge benefits to the score as well.
With Kingston's claim of the 6000MB/s maximum read speed of the NV3 2TB, it was interesting to see if we could see this result in any of our tests. Looking at the sequential results, the NV3 2TB did indeed meet and exceed these claims, reaching 6254.01MB/s read and 5702.05MB/s write. Across the board, the Kingston NV3 2TB performed admirably, but remained in the middle of the pack for these tests. Remarkably, it was near the best in the random 4K, 32-queue test. Compared to other QLC-based drives, the NV3 2TB was slower than the NV7000-Q but faster than the Crucial P3 Plus in majority of the tests. Against the other Kingston predecessors, the results were a bit mixed, with sequential results of the NV3 being slower than the KC3000 and the FURY Renegade, but the random results being more competitive. Otherwise, you can make comparisons from the graphs above.
Page Index
1. Introduction, Packaging, Specifications
2. A Closer Look, Test System
3. Benchmark: AIDA64 Disk Benchmark
4. Benchmark: ATTO Disk Benchmark
5. Benchmark: Crystal Disk Mark 8.0
6. Benchmark: HD Tune Pro 5.70
7. Benchmark: PassMark PerformanceTest 10
8. Benchmark: PCMark 10
9. Benchmark: 3DMark
10. Conclusion
